MacSpectrum (v1.0.1)
Run MacSpectrum (If the link does not work, Try our back-up server.):
MacSpectrum is a macrophage annotation system that allows comprehensive analysis of heterogeneous subpopulations and their multifaceted activation states under various in vitro and in vivo conditions, including the identification of condition-specific signature genes. Each subpopulation identified by MacSpectrum can be further analyzed for cell function and intracellular signaling networks in conjunction with other programs, such as Ingenuity Pathway Analysis by Qiagen, NIH DAVID, and others.
With MacSpectrum, you can:
1. generate MacSpectrum Plots to visualize heterogeneity of your macrophage data-sets.
2. Identify and visualize signature gene list in macrophage subsets identified by MacSpectrum.
For other functions, including query for gene expression pattern in the existing transcriptome profiles, will be provided in the coming versions. For specific questions, please contact us.
MacSpectrum currently only accepts Ensembl ID as gene ids. And we provide two worktables to facilitate converting from Gene Names to Ensembl IDs for human and mouse genes. Please refer to the User Instructions for details.
***If you use MacSpectrum to analyze your experiments, please cite: Chuan Li, Antoine Menoret, Cullen Farragher, Zhengqing Ouyang, Christopher Bonin, Paul Holvoet, Anthony T. Vella, Beiyan Zhou. Single cell transcriptomics-based MacSpectrum reveals novel macrophage activation signatures in diseases. JCI insight. April 16 2019. PMID: 30990466
Quick Guide (Please see User Instruction for details):
To run a query of your macrophage samples (If the link does not work, Try our back-up server.):
1. Launch the MacSpectrum program.
2. Select “mouse” or “human” for sample origin of your dataset.
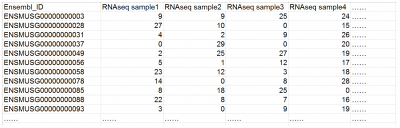
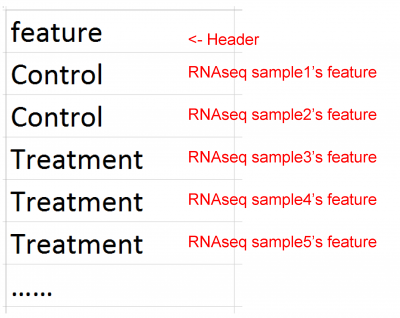
3. Click “Upload” buttons to upload the:
a. gene-sample table file (.csv) (one column of Ensembl ID+ Expression (eg. FPKM) columns)
b. feature file (.csv) (your sample groups/treatments)
4. Click “Go!” to run the calculation.
Depending on the size of your dataset, the calculation may take one or several minutes. Human samples may take extra time due to the procedure of mapping to mouse gene homologs.
** Two workable tables for Ensemble ID conversion (if you do not have them)
Converting from Gene Names (e.g. NOS2/Nos2 ) to Ensembl ID
IDs for human
IDs for mouse
Note: not all Gene Names have corresponding Ensembl IDs, so some of genes will be labelled as “#N/A”; this is fine, as MacSpectrum will automatically filter them out before the calculations.
Please refer to the User Instructions for detailed explanations.
Do not have data yet? You can try MacSpectrum using our simulated data-set example.